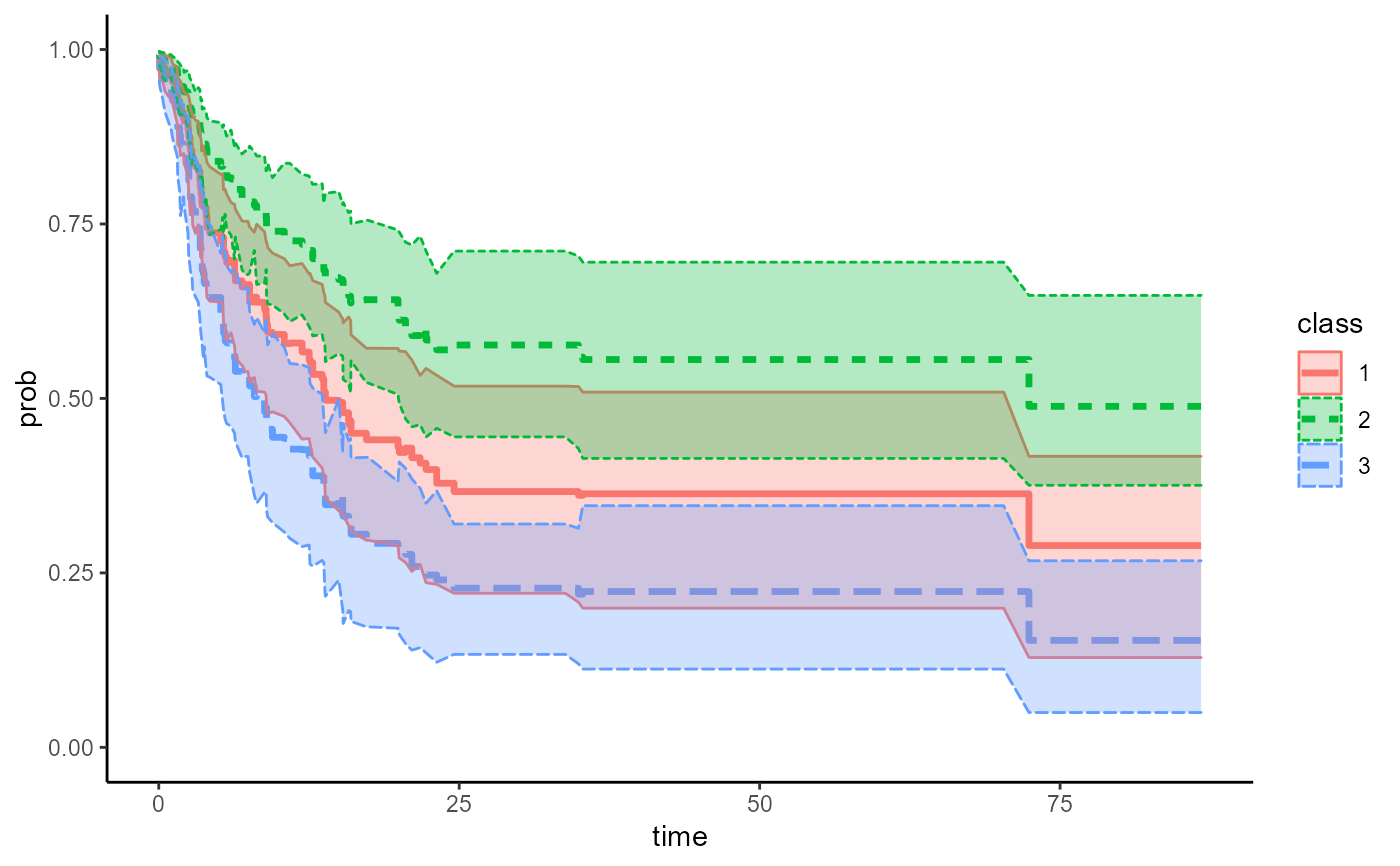
Generate adjusted KM plot with bootstrap CI
adjKM_CI_plot.RdUse results from boot_ci_adj_km() and input dataset to generate adjusted KM plot with bootstrap CI (users can also produce a figure by using ggplot2)
adjKM_CI_plot(res, data)Arguments
- res
results from boot_ci_adj_km()
- data
the input dataset
Value
Adjusted CIF plot with CI will be shown after running this function
Examples
library(KMsurv)
data(bmt)
bmt$arm <- bmt$group
bmt$arm = factor(as.character(bmt$arm), levels = c("2", "1", "3"))
bmt$z3 = as.character(bmt$z3)
bmt$t2 = bmt$t2 * 12/365.25

result1_1 = boot_ci_adj_km(boot_n = 100, ci_cut = c(0.025, 0.975), data = bmt, time = "t2",
status = "d3", group = "arm", covlist = c("z1", "z3"), stratified_cox = "No",
reference_group = NULL)

adjKM_CI_plot(result1_1, bmt)
